Whenever we are unsure about the outcome of an event, we can talk about the probabilities of certain outcomes—how likely they are. The analysis of events governed by probability is called statistics. Probability and statistics are the basis of data science. Probability theory is much more helpful for making predictions. Estimates and predictions are an important part of data science. With the help of statistical methods, we make estimates for further analysis. Thus, statistical methods largely depend on the principle of probability. And all probability and statistics depend on the data.
Before read this topic
Contents
Data
Data collected is information (observations) that we have about something or facts and figures collected for reference or analysis. It is collection of facts (numbers, words, measurements, observations, etc.) that have been translated into a form that computers can process.
Event
An event is something that may or may not occur at some time or during some period in the future.
Experiment
These are uncertain circumstances, which can have many consequences. Experiment is a test in which we perform a number of tests to enable us to measure the probability of a future event.
Outcome
It is a possible result of an experiment or test. Each possible outcome of a particular experiment is unique, and the different outcomes are mutually exclusive (there will be only one outcome on each trial of the experiment). Probability and Statistics
Probability
Probability means possibility. It is simply how likely something is to happen.
Random Variables
A random variable usually denoted as X is variable whose values are numerical outcomes of some random process. There are two types of random variable Discrete and Continuous.
Discrete Random Variable
Discrete variables are countable in a finite amount of time. Probability and Statistics
Example :-
The number of times a coin lands on tail after being flipped 20 times.
Continuous Random Variable
A Continuous Variable is one which can take on an infinite number of possible value.
Example:-
Height of a person
Time required to run a mile.
Population or Sample Data in Probability and Statistics
Before performing any analysis of data, we should determine if the data we’re dealing with is population or sample.
Population
The collection of all objects is (N) and includes each unit of our study. It is difficult to define and the measure of a characteristic like mean, mode is called parameter.
Sample
The subset (n) of the population and it includes only a handful of units of the population. It is chosen at random and the measure of the trait is called a statistic.
Measures of Central Tendency
The measure of central tendency is a single value that attempts to describe a set of data by identifying the central position within that set of data.
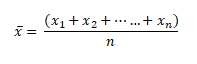
Mean
The mean is equal to the sum of all the values in the data set divided by the number of values in the data set i.e the calculated average.
Outlier
when unusual values are added in data then it gets skewed i.e deviates from the typical central value.
Probability and Statistics
Median
The median is the middle value for a dataset that is arranged in order of magnitude. The median is a better substitute for the mean as it is less affected by outliers and skewness of the data. The mean value is much closer than the typical central value.
If the total number of values is odd then
Median = (n+1)/2 -th term
If the total number of values is even then
Median = ( (n/2)th observation+(n/2 +1)th observation ) / 2
Mode
That mode is the most occurring value in the dataset. mod, therefore one can sometimes consider mod as the most popular option.
More Details about Probability and Statistics